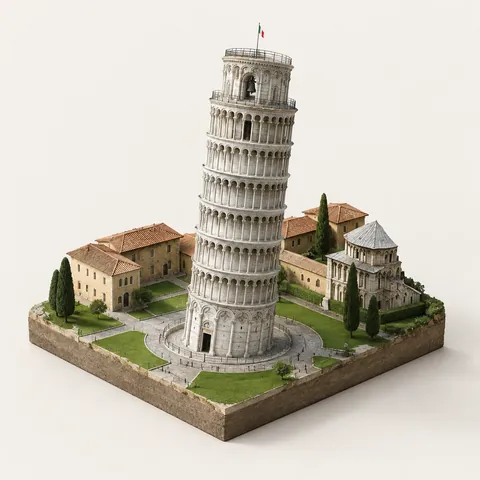
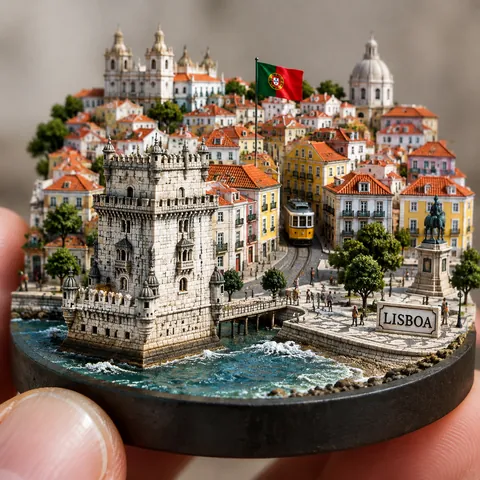
A data-physicalization template shared by @Gdgtify. Give it a topic and it picks one statistic that can be shown as volume, mass, money, data or waste, then builds a single perfect cube from the material that statistic implies, with a minimal caption and a human-scale reference. The goal is to make an impossible quantity feel measurable. We used one year of household food waste. Good for explainer posts, reports, sustainability campaigns and editorial infographics.
How to adapt it
Variable
What it changes
Examples
[TOPIC]
topic
global coffee consumption per day, plastic bottles sold per minute
one perfect cube
shape
one perfect sphere, one stacked column
Tips
Topics with a physical material make the strongest cubes.
Ask for a human figure for scale.
Check any numbers it writes; treat them as illustrative.